Business on railways - Railway transportation. Investing in your own rolling stock
For Russian business the question cargo transportation especially relevant. Just look at the size of the country. But often, when you hear the word cargo transportation, what comes to mind is a huge truck plying far from ideal domestic roads. However, a considerable part of cargo is transported by rail. What's interesting is that sometimes without rail transportation It’s simply not possible, especially when it comes to large equipment or any other cargo. Why? The site’s correspondent asked the head of the customer service department of the company “Capital Cargo Agency” about this. Konstantina Bezruchko.
— Why is rail transportation in modern Russia not as popular as it could be?
— Yes, indeed, such a tendency exists. And this is connected with the feeling of speed and apparent simplicity of cargo transportation by road. The growth of the fleet of vehicles with a wide variety of capabilities, the construction of roads, the emergence of a large number of logistics companies specializing in road transport created the appearance of a wide territorial coverage of the country.
And the technological capabilities of the vehicles themselves have become much wider - low-loading platforms with a high load capacity and the availability of special means for loading and placing cargo can easily compete with a railway platform. And large self-propelled vehicles, which previously acted as cargo, are now sent by truck even over very long distances, which also takes a certain volume from railway transportation.
— When and in what cases is it profitable to use railway transportation, when you simply cannot do without it?
— First of all, these are transportation to hard-to-reach or remote areas. Secondly, cargo transportation heavy and oversized cargo, however, the possibilities of road transportation for such cargo have their limitations. And third - large consignments of cargo. Their rational distribution on rolling stock makes it possible to reduce freight transportation costs.
In some cases, it is more reliable and safer to send particularly valuable cargo by rail in covered wagons and containers. Statistics show that the number of unsafe shipments in the case of auto delivery of goods is higher than with railway transportation.
— What types of cargo are most often transported by rail today, and why?
— A significant volume is accounted for by the transportation of raw materials. This is due to the economic and geographical features of our country - the remoteness of resource sources and their consumers from each other. Industrial cargo includes transportation of equipment and materials. Moreover, transportation in containers is very popular.
Container Shipping equipment is reliable and economical. Also, transportation in containers is very convenient for the consignee - the container first travels by rail to the destination station, and then the cargo without unnecessary reloading (in the container) can be delivered by road to the consignee's door. Thus, cargo is delivered according to the “door to door” scheme.
 — What are the main pros and cons of transportation by rail?
— An absolute advantage of rail transportation is safety and security when using enclosed rolling stock. Another significant advantage is the cost-effectiveness of transporting oversized or heavy cargo over long distances.
But the timing is, perhaps, the main disadvantage railway transportation. The railway is characterized by both a long period of transportation itself and the preparation period for it.
— In the case of transporting oversized cargo by rail, what points should you pay special attention to?
— When transporting any cargo by rail, the shipper must always provide an accurate description of the cargo; this can significantly reduce the preparation time for shipment and avoid unexpected expenses. In the case of transporting heavy or oversized cargo, it is necessary to know about the consignee’s ability to receive this cargo at the destination station (that is, to know about the capabilities of the station and the presence of mechanized unloading facilities at it).
— What additional services do you provide when transporting goods by rail?
— « Capital freight agency» is an operator of industrial cargo in Russia and offers its clients a full range of logistics services for these cargoes. We send cargo by rail in covered wagons, gondola cars, on platforms, various specialized transporters and universal containers. We send cargo from railway stations in Moscow and St. Petersburg.
 At the direction of shippers, we carry out loading and unloading operations using truck cranes of various lifting capacities, transporting cargo to the departure station, transit storage of cargo in warehouses, loading and securing cargo on a vehicle, additional packaging and labeling. For all cargo, personal loading and securing schemes are developed and approved in the relevant structures of Russian Railways. If oversized cargo is presented for transportation, we suggest reducing its dimensions by dismantling removable parts. When the cargo is ready for shipment, it is photographed and the photographic materials are provided to the shipper.
In Moscow and the Moscow region, we can perform rigging work related to dismantling and removal of cargo.
And now our company, together with partners, is implementing a program to support shippers of large industrial cargo. As part of this program, prices have been reduced and preferential conditions have been established for a number of logistics services for transportation in wagons, gondola cars and on platforms.
— Which directions of rail transportation would you define as the most popular today?
— I would say that these are the Eastern (Transbaikalia, Primorsky Territory) and Northern (Komi, Yamal Peninsula) directions. This is due to the remoteness and inaccessibility, the lack of roads in these directions. And of course, the demand for various types of industrial cargo for economic activities in these regions.
![]()
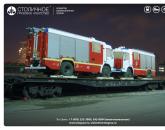
Capital freight agency
Central office of JSC "Capital Cargo Agency":
Moscow, Balakirevsky lane, 1 A, entrance 1, floor 3.
Website www.stogruz.ru E-mail: welcome@stogruz.ru
The essence of the project is to create a railway transportation operator company. The latter purchases old cars from the Russian Ministry of Railways, carries out major overhauls to extend the useful life of these cars, and organizes railway transportation using its own rolling stock. The goal of the project is to optimize the railway transportation of JSC XXX, as well as to generate profit from transportation to third parties.
1 Summary
The project is being implemented by ZAO XXX. The essence of the project is to create a railway transportation operator company. The latter purchases old cars from the Russian Ministry of Railways, carries out major overhauls to extend the useful life of these cars, and organizes railway transportation using its own rolling stock. The goal of the project is to optimize the railway transportation of JSC XXX, as well as to generate profits from transportation to third parties.
The calculation horizon was 5.5 years - the period from the second half of 2002 to 2007.
Div class="contentByTheme__wrapper" style="padding: 18px 18px 10px 18px;">
The main consumer of the services of the created operator company is the cargo-generating enterprise CJSC XXX, which accounts for more than 80% of cargo turnover. There are agreements on transportation volumes with third-party organizations: factories A, B, C, D. The company plans to set transportation prices at the level of MRT tariffs and conduct non-price competition. The operating carrier - the Ministry of Railways of Russia - often cannot provide its customers with a normal level of service. Cargo owners using the services of an operator company receive guarantees that their cargo will be removed in full, on time and according to a pre-approved schedule.
In 2003, transportation volumes will amount to 1944 thousand tons, by 2007 it is planned to reach a level of 3240 thousand tons. The estimated inventory of cars for these volumes of transportation is 844 cars in 2003 and 1388 cars in 2007.
The total cost of the project is 11,072,258 US dollars.
At the stage of enterprise creation (2nd half of 2002), financial support for the project is carried out at the expense of the own funds of the cargo-forming enterprise - the founder of the operating company - CJSC "XXX" in the amount of 3,400,000 dollars and through a bank loan in the amount of 3,400 '000 dollars. The loan is taken out for 2 years at a rate of 25% per annum with quarterly interest payments. Repayment of the principal debt begins 1 year after receiving the loan: at the end of the first year, 50% of the amount of the loan received is repaid, at the end of the second year the balance of the debt is paid. In subsequent years, the project is financed from the profit received by the operating company.
The average annual net profit will be $3,105,339. Break-even analysis showed that the company has a large margin of financial strength.
The analysis of financial ratios showed that by the end of 2003 the enterprise became financially stable, and by the end of 2004 it became absolutely liquid. The return and return on capital ratios initially increase, but then tend to decrease, because accumulation of own funds occurs. The average profitability of sales is 21%, the average profitability of transportation is 26%. Taking all this into account, we can draw a conclusion about the financial viability of the project.
Let's evaluate the economic viability of the project.
A positive balance of accumulated real money is ensured in all billing periods, which is a condition for the feasibility of the project. The effectiveness of the project is characterized by the following indicators: the discounted payback period of the PP project is 4.1 years, which< 5,5 лет - горизонта расчета; чистый приведенный доход NPV - 2’335’441 долл. (>0); internal rate of return IRR - 50% - > discount rate equal to 30%; profitability index PI - 1.14 (>1).
2 Information about the enterprise and industry
In the conditions of increasingly widespread market relations, the need arose to reform the Ministry of Railways - until recently the only railway carrier in Russia. Currently, the objectives of the reform are to separate the functions of state regulation and economic activities of the Ministry of Railways, the creation of the Open Joint Stock Company "Russian Railways", as well as the creation of a competitive environment on the country's railways, i.e. the emergence of private companies operating railway transportation with their own rolling stock.
Operating wagons is an integral part of the supply and sales system of JSC XXX. The territorial scale and mass quantity of cargo require a reduction in the cost of transportation and a full provision of the enterprise with wagons.
Today, CJSC XXX is experiencing a shortage of railcars. Cargoes are not always transported completely and on time. Violation of transportation schedules leads to a decrease in the turnover of the enterprise's working capital, delays in the production process, violations of the terms of contracts for the supply of products, and an increase in transportation costs due to fines issued by the Ministry of Railways for rented cars.
The use of the services of a specialized operator company will allow optimizing the enterprise's railway transportation and turning the supply and sales system of JSC "XXX" into a truly effective mechanism for competition, because the operating company has the ability to regulate the supply of empty cars, provide the required number of cars and reduce the cost of transportation by reducing the empty mileage of cars.
To meet the transport needs of CJSC XXX, it was decided to create a railway transportation operator company, TransAlex LLC.
Table 1 - Information about the applicant for the status of a company operating its own rolling stock
The cargo-generating enterprise, which is the founder of the operating company, is CJSC “XXX”. The company produces building materials: large-panel house-building products, road and fence slabs, floor slabs, paving slabs, sleepers, foundation blocks. CJSC "XXX", founded in 19XX, is currently one of the ten largest producers of reinforced concrete in Russia.
Information about the cargo-generating enterprise is summarized in Table 2
Table 2 - Information about the cargo-forming enterprise
Statistical data on the actual volumes of transportation of JSC "XXX" for 2000-2001. separately by type of cargo and transportation directions are given in Table 3.
Table 3 - Statistical data on actual transportation volumes
| Transportation direction | Car type | Cargo | Transportation volume, thousand tons/year | Types of shipment | Distance, km | ||
| Art. departures | Art. appointments | 2000 | 2001 | ||||
| SUDZhD | |||||||
| Troitsk | Metallurgical | dump car | sand | 86,00 | 142,00 | pinwheel | 147 |
| Mechel | Metallurgical | dump car | granulated slag | 96,00 | 93,00 | pinwheel | 5 |
| Asphalt | Metallurgical | dump car | crushed stone | 110,00 | 86,00 | pinwheel | 48 |
| Shartymka | Metallurgical | dump car | crushed stone | 0,00 | 13,00 | pinwheel | 150 |
| Strawberry | Metallurgical | hopper cement tanker | cement | 98,00 | 96,00 | Unaccompanied | 72 |
| Metallurgical | Asphalt | platform | reinforced concrete | 0,06 | by carload | 48 | |
| Metallurgical | Burannaya | platform | reinforced concrete | 0,24 | by carload | 406 | |
| Metallurgical | Vargoshi | platform | reinforced concrete | 0,25 | by carload | 305 | |
| Metallurgical | Verkhniy Ufaley | platform | reinforced concrete | 0,13 | by carload | 168 | |
| Metallurgical | Dalmatovo | platform | reinforced concrete | 0,31 | by carload | 228 | |
| Metallurgical | Zlatoust | platform | reinforced concrete | 0,44 | by carload | 186 | |
| Metallurgical | Golden Hill | platform | reinforced concrete | 1,68 | 0,29 | by carload | 157 |
| Metallurgical | Kartaly-1 | platform | reinforced concrete | 0,13 | 0,62 | by carload | 287 |
| Metallurgical | Red hill | platform | reinforced concrete | 0,37 | 0,26 | by carload | 326 |
| Metallurgical | Kuybas | platform | reinforced concrete | 6,53 | 7,23 | groups of cars | 418 |
| Metallurgical | Mound | platform | reinforced concrete | 5,41 | 3,76 | groups of cars | 266 |
| Metallurgical | Kyshtym | platform | reinforced concrete | 0,43 | by carload | 116 | |
| Metallurgical | Magnitogorsk-Gruzovoy | platform | reinforced concrete | 2,61 | by carload | 428 | |
| Metallurgical | Mauk | platform | reinforced concrete | 0,43 | by carload | 139 | |
| Metallurgical | Mednogorsk | platform | reinforced concrete | 0,38 | 0,57 | by carload | 664 |
| Metallurgical | Exchange yard | platform | reinforced concrete | 0,61 | by carload | 895 | |
| Metallurgical | Miass-1 | platform | reinforced concrete | 0,18 | 0,49 | by carload | 122 |
| Metallurgical | Nizhnyaya Uvelskaya | platform | reinforced concrete | 2,87 | 0,24 | by carload | 108 |
| Art. departures | Art. appointments | 2000 | 2001 | ||||
| Metallurgical | Orenburg | platform | reinforced concrete | 3,73 | by carload | 887 | |
| Metallurgical | Orsk | platform | reinforced concrete | 5,04 | groups of cars | 556 | |
| Metallurgical | Half Katavskaya | platform | reinforced concrete | 0,06 | by carload | 340 | |
| Metallurgical | Potanino | platform | reinforced concrete | 0,38 | by carload | 18 | |
| Metallurgical | Profintern | platform | reinforced concrete | 0,25 | 0,06 | by carload | 654 |
| Metallurgical | Saraktash | platform | reinforced concrete | 1,55 | by carload | 782 | |
| Metallurgical | Sibay | platform | reinforced concrete | 0,23 | by carload | 537 | |
| Metallurgical | Sorochinskaya | platform | reinforced concrete | 0,28 | by carload | 1056 | |
| Metallurgical | Troitsk | platform | reinforced concrete | 0,17 | by carload | 147 | |
| Metallurgical | Urzhumka | platform | reinforced concrete | 0,31 | by carload | 167 | |
| Metallurgical | Chelyabinsk-Gruzovoy | platform | reinforced concrete | 0,19 | 0,06 | by carload | 28 |
| Metallurgical | Chelyabinsk-Yuzhny | platform | reinforced concrete | 0,12 | 0,94 | by carload | 32 |
| Metallurgical | Churilovo | platform | reinforced concrete | 5,06 | groups of cars | 17 | |
| Metallurgical | Shagol | platform | reinforced concrete | 0,75 | by carload | 43 | |
| Metallurgical | Shadrinsk | platform | reinforced concrete | 0,75 | 2,13 | by carload | 274 |
| Metallurgical | Hornets | platform | reinforced concrete | 0,65 | by carload | 31 | |
| Metallurgical | Yuryuzan | platform | reinforced concrete | 0,12 | by carload | 322 | |
| Sverdlovsk Railway | |||||||
| Metallurgical | Bakharevka | platform | reinforced concrete | 0,06 | by carload | 630 | |
| Metallurgical | Verkhnekondinskaya | platform | reinforced concrete | 0,24 | 0,18 | by carload | 894 |
| Metallurgical | Voynovka | platform | reinforced concrete | 8,90 | 11,78 | groups of cars | 436 |
| Metallurgical | Wonyegan | platform | reinforced concrete | 0,68 | by carload | 999 | |
| Art. departures | Art. appointments | 2000 | 2001 | ||||
| Metallurgical | Geological | platform | reinforced concrete | 6,32 | groups of cars | 879 | |
| Metallurgical | Evo-Yaha | platform | reinforced concrete | 0,42 | by carload | 1686 | |
| Metallurgical | Zavodoukovskaya | platform | reinforced concrete | 0,13 | by carload | 525 | |
| Metallurgical | Kogalym | platform | reinforced concrete | 10,82 | groups of cars | 1281 | |
| Metallurgical | Korotchaevo | platform | reinforced concrete | 9,88 | 11,16 | groups of cars | 1577 |
| Metallurgical | Kut-Yakh | platform | reinforced concrete | 0,19 | 0,96 | by carload | 992 |
| Metallurgical | Langepasovsky | platform | reinforced concrete | 3,5 | by carload | 1266 | |
| Metallurgical | Megion | platform | reinforced concrete | 7,25 | 2,4 | by carload | 1307 |
| Metallurgical | Mortko | platform | reinforced concrete | 0,5 | by carload | 669 | |
| Metallurgical | Nevyansk | platform | reinforced concrete | 0,06 | by carload | 358 | |
| Metallurgical | Nizhnevartovsk | platform | reinforced concrete | 12,13 | 7,66 | groups of cars | 1349 |
| Metallurgical | New Urengoy | platform | reinforced concrete | 1,12 | by carload | 1686 | |
| Metallurgical | Noyabrsk-1 | platform | reinforced concrete | 2,91 | by carload | 1391 | |
| Metallurgical | Noyabrsk-2 | platform | reinforced concrete | 29,12 | 34,97 | groups of cars | 1403 |
| Metallurgical | Nyagan | platform | reinforced concrete | 0,43 | by carload | 1035 | |
| Metallurgical | Ostrovny | platform | reinforced concrete | 3,49 | 10,92 | groups of cars | 1117 |
| Metallurgical | Pangodas | platform | reinforced concrete | 2,64 | 0,9 | by carload | 1686 |
| Metallurgical | Pelym | platform | reinforced concrete | 0,86 | 0,17 | by carload | 1645 |
| Metallurgical | Priobye | platform | reinforced concrete | 6,32 | 12,6 | groups of cars | 1082 |
| Metallurgical | Purovsk | platform | reinforced concrete | 7,40 | 0,91 | by carload | 1686 |
| Metallurgical | Purpe | platform | reinforced concrete | 0,24 | 5,96 | groups of cars | 1575 |
| Art. departures | Art. appointments | 2000 | 2001 | ||||
| Metallurgical | Pyt-Yakh | platform | reinforced concrete | 6,09 | 13,38 | groups of cars | 1062 |
| Metallurgical | Salym | platform | reinforced concrete | 0,37 | 0,77 | by carload | 945 |
| Metallurgical | Sverdlovsk-Tovarny | platform | reinforced concrete | 0,06 | 0,83 | by carload | 277 |
| Metallurgical | Suzgun | platform | reinforced concrete | 0,68 | by carload | 647 | |
| Metallurgical | Surgut | platform | reinforced concrete | 80,72 | 70,49 | groups of cars | 1133 |
| Metallurgical | Surgut-port | platform | reinforced concrete | 3,97 | 18,72 | groups of cars | 1148 |
| Metallurgical | Syvdarma | platform | reinforced concrete | 9,36 | 4,66 | by carload | 1686 |
| Metallurgical | Tobolsk | platform | reinforced concrete | 0,25 | 0,18 | by carload | 657 |
| Metallurgical | Tobolsk-port | platform | reinforced concrete | 0,06 | 0,96 | by carload | 663 |
| Metallurgical | Turensk Uralsky | platform | reinforced concrete | 0,06 | by carload | 414 | |
| Metallurgical | Tyumen | platform | reinforced concrete | 8,78 | 5,15 | groups of cars | 428 |
| Metallurgical | Uktus | platform | reinforced concrete | 0,13 | by carload | 261 | |
| Metallurgical | Ust-Akha | platform | reinforced concrete | 2,80 | 2,75 | by carload | 696 |
| Metallurgical | Farafentyevskaya | platform | reinforced concrete | 0,12 | 3,94 | by carload | 1686 |
| Metallurgical | Black Cape | platform | reinforced concrete | 9,51 | 68,37 | groups of cars | 1139 |
| Metallurgical | Yagelnaya | platform | reinforced concrete | 0,43 | 2,66 | by carload | |
| Kuibyshevskaya Railway: | |||||||
| Metallurgical | Asha | platform | reinforced concrete | 0,75 | by carload | 403 | |
| Metallurgical | Beloretsk | platform | reinforced concrete | 0,18 | 0,24 | by carload | n/a |
| Metallurgical | Tikhonovo | platform | reinforced concrete | 0,12 | by carload | n/a | |
| Art. departures | Art. appointments | 2000 | 2001 | ||||
| Oktyabrskaya Railway: | |||||||
| Metallurgical | Belamorsk | platform | reinforced concrete | 0,67 | by carload | n/a | |
| Moscow Railway: | |||||||
| Metallurgical | Likhobory | platform | reinforced concrete | 0,55 | by carload | n/a | |
| Metallurgical | Moscow - Sorting | platform | reinforced concrete | 0,24 | by carload | n/a | |
| Northern Railway: | |||||||
| Metallurgical | Labytnangi | platform | reinforced concrete | 0,74 | by carload | 2812 | |
| Metallurgical | Sosnogorsk | platform | reinforced concrete | 0,06 | by carload | n/a | |
| Metallurgical | Usinsk | platform | reinforced concrete | 0,7 | by carload | n/a | |
| Kazakhstan Railway: | |||||||
| Metallurgical | Aristansor | platform | reinforced concrete | 1,23 | by carload | n/a | |
| Metallurgical | Arkalyk | platform | reinforced concrete | 0,28 | by carload | n/a | |
| Metallurgical | Pavlodar | platform | reinforced concrete | 2,03 | by carload | n/a | |
| West Siberian Railway: | |||||||
| Metallurgical | Tomsk-2 | platform | reinforced concrete | 0,06 | by carload | n/a | |
| Privolzhskaya Railway: | |||||||
| Metallurgical | Aksarayskaya | platform | reinforced concrete | 0,44 | by carload | n/a | |
| Total | 620,00 | 795,00 | |||||
3 Marketing plan
The main consumer of the services of the created operator company is the cargo-generating enterprise CJSC XXX, which accounts for more than 80% of cargo turnover. There are agreements on the volume of transportation with third-party organizations: plants A, B, C, D. All of these enterprises (CJSC "XXX" and third-party organizations) currently use the services of the Ministry of Railways. Operating companies working on the South Ural Railway (MMK-Trans LLC, Firma TransGarant LLC, UralEnergoProm LLC) serve specific enterprises, i.e. in their pure form are not competitors of the operating company being created. The company plans to set prices for transportation at the level of MRT tariffs, i.e. charge for services the Ministry of Railways tariff for transportation with its own rolling stock plus a rental fee for the use of cars, and conduct non-price competition with the existing carrier - the Russian Ministry of Railways, which often cannot provide its customers with a normal level of service. Cargo owners using the services of an operator company receive guarantees that their cargo will be removed in full, on time and according to a pre-approved schedule.
Table 4 presents the planned volumes of transportation for CJSC XXX and third-party organizations by year of project implementation (period from 2003 to 2007).
Table 4 - Planned transportation volumes (thousand tons)
The calculation of transportation volumes for ZAO XXX was carried out on the basis of data from the planning and economic department of the plant: production volumes of finished products in 2003 will amount to 30 thousand cubic meters of reinforced concrete per month, which corresponds to 66 thousand tons; to produce a given amount of finished products, the same amount (66 thousand tons) of raw materials will be required; in each subsequent year, monthly production volumes of finished products will be 5 thousand cubic meters more than in the previous year. Monthly transportation volumes for third-party organizations for 2003 are determined at 30 thousand tons; in each subsequent year, monthly transportation will increase by 5 thousand tons.
4 Production plan
Based on the marketing plan, a production program of the operating company was developed - data on the planned volumes of transportation by type of cargo and transportation routes, summarized in Table 5. Table 6 presents the results of calculating the inventory of wagons and the planned purchase schedule for wagons (detailed calculation of the wagon fleet and quarterly For the schedule for the purchase and renovation of our own rolling stock, see Appendix A of Table A.1-A.3). Table 7 summarizes data on planned capital investments in purchase and overhaul. The cost of old cars: gondola car - $3226 (hereinafter - $), platform - $2581, dump car - $3226, dispenser - $2258, cement tanker - $3871. The cost of overhaul repairs of 1 carriage is $4839. The total cost of the project is $11,072,258.
In the same section, current fixed costs were calculated for the elements and types of costs necessary for the normal functioning of the operating company. These are the costs of maintaining the operator company (salaries of employees, unified social tax with payroll, office rent), depreciation charges on its own fleet of cars, costs of repair and maintenance of its own fleet of cars (costs of preventive work necessary to maintain cars in working condition, costs for depot and major repairs), property tax.
For calculation of the wage fund for employees of the operating company, see Appendix A, Table A.4. The single social tax rate is 35.6% of the payroll. The monthly office rental fee is $581.
The method of calculating depreciation is linear, the depreciation rate is 14.3% - based on the useful life of the cars after major repairs, equal to 7 years.
The cost of preventive (current) repairs of cars is $13 per car per month. Depot repairs are carried out once every 2 years, its cost is:
Table 5 - Planned traffic volumes
| Transportation direction | Car type | Cargo | Transportation volume, thousand tons/year | Types of shipment | Distance, km | ||||||||
| departure station | destination station | 2003 | 2004 | 2005 | 2006 | 2007 | 2008 | 2009 | present time | operator company | |||
| Troitsk | Metallurgical | dump car | sand | 238 | 277 | 317 | 356 | 396 | 396 | 396 | pinwheel | pinwheel | 147 |
| Mechel | Metallurgical | dump car | granulated slag | 158 | 185 | 211 | 238 | 264 | 264 | 264 | pinwheel | pinwheel | 5 |
| Asphalt | Metallurgical | dispenser | crushed stone | 190 | 222 | 253 | 285 | 317 | 317 | 317 | pinwheel | pinwheel | 48 |
| Shartymka | Metallurgical | dispenser | crushed stone | 24 | 28 | 32 | 36 | 40 | 40 | 40 | pinwheel | pinwheel | 150 |
| Strawberry | Metallurgical | cement tanker | cement | 182 | 213 | 243 | 273 | 304 | 304 | 304 | Unaccompanied | Unaccompanied | 72 |
| Metallurgical | Surgut | gondola car | reinforced concrete | 166 | 194 | 222 | 249 | 277 | 277 | 277 | groups of cars | route | 1133 |
| Metallurgical | Surgut-port | gondola car | Same | 159 | 185 | 212 | 238 | 265 | 265 | 265 | groups of cars | route | 1148 |
| Metallurgical | Black Cape | gondola car | Same | 44 | 52 | 59 | 67 | 74 | 74 | 74 | groups of cars | groups of cars | 1139 |
| Metallurgical | Ufa | gondola car | Same | 79 | 92 | 106 | 119 | 132 | 132 | 132 | - | groups of cars | 481 |
| Metallurgical | Tyumen | gondola car | Same | 32 | 38 | 43 | 49 | 54 | 54 | 54 | groups of cars | groups of cars | 430 |
| Metallurgical | Orsk | gondola car | Same | 31 | 36 | 41 | 46 | 51 | 51 | 51 | by carload | groups of cars | 556 |
| Metallurgical | Magnitogorsk | gondola car | Same | 16 | 18 | 21 | 24 | 26 | 26 | 26 | by carload | groups of cars | 428 |
| Metallurgical | Surgut | platform | reinforced concrete | 83 | 97 | 111 | 125 | 139 | 139 | 139 | groups of cars | route | 1133 |
| departure station | destination station | 2003 | 2004 | 2005 | 2006 | 2007 | 2008 | 2009 | present time | operator company | |||
| Metallurgical | Surgut-port | platform | reinforced concrete | 79 | 93 | 106 | 119 | 132 | 132 | 132 | groups of cars | route | 1148 |
| Metallurgical | Black Cape | platform | Same | 22 | 26 | 30 | 33 | 37 | 37 | 37 | groups of cars | groups of cars | 1139 |
| Metallurgical | Ufa | platform | Same | 40 | 46 | 53 | 59 | 66 | 66 | 66 | - | groups of cars | 481 |
| Metallurgical | Tyumen | platform | Same | 16 | 19 | 22 | 24 | 27 | 27 | 27 | groups of cars | groups of cars | 430 |
| Metallurgical | Orsk | platform | Same | 15 | 18 | 21 | 23 | 26 | 26 | 26 | by carload | groups of cars | 556 |
| Metallurgical | Magnitogorsk | platform | Same | 8 | 9 | 11 | 12 | 13 | 13 | 13 | by carload | groups of cars | 428 |
| Metallurgical | Vladivostok | gondola car | ferrous metal rental | 240 | 280 | 320 | 360 | 400 | 400 | 400 | - | route | 7379 |
| Metallurgical | Novorossiysk | gondola car | Same | 80 | 93 | 107 | 120 | 133 | 133 | 133 | - | route | 2664 |
| Metallurgical | Samara | gondola car | Same | 8 | 9 | 11 | 12 | 13 | 13 | 13 | - | groups of cars | 1004 |
| Metallurgical | Vologda | gondola car | Same | 8 | 9 | 11 | 12 | 13 | 13 | 13 | - | groups of cars | 1739 |
| Metallurgical | Ryazan | gondola car | Same | 8 | 9 | 11 | 12 | 13 | 13 | 13 | - | groups of cars | 1787 |
| Metallurgical | Moscow | gondola car | Same | 8 | 9 | 11 | 12 | 13 | 13 | 13 | - | groups of cars | 1899 |
| Metallurgical | Rostov | gondola car | Same | 8 | 9 | 11 | 12 | 13 | 13 | 13 | - | groups of cars | 2403 |
Table 6 - Planned schedule for the purchase of cars on the routes under consideration (in cars)
Table 7 - Planned investment in rolling stock (in US dollars)
Table 8 - Current fixed costs of the operator company (in US dollars)
| Article | Year | |||||
| 2nd floor 2002 | 2003 | 2004 | 2005 | 2006 | 2007 | |
| Wage | 21 484 | 42 968 | 42 968 | 42 968 | 42 968 | 42 968 |
| UST | 7 648 | 15 297 | 15 297 | 15 297 | 15 297 | 15 297 |
| Office rental | 3 484 | 6 968 | 6 968 | 6 968 | 6 968 | 6 968 |
| Depreciation of wagons | - | 961 751 | 1 110 922 | 1 262 673 | 1 427 788 | 1 581 751 |
| Maintenance | - | 130 684 | 150 968 | 171 561 | 194 013 | 214 916 |
| Depot repairs | - | - | - | 434 097 | 67 329 | 502 506 |
| Property tax | 33 661 | 130 249 | 130 496 | 128 473 | 124 294 | 110 365 |
| Total current fixed expenses | 66 277 | 1 287 916 | 1 457 617 | 2 062 036 | 1 878 656 | 2 474 771 |
gondola car - $503, dump car - $729, dispenser - $526, platform - $474, cement tanker - $526. Major repairs are carried out 7 years after the major restoration; we do not take them into account, because the need to carry it out will occur beyond the calculation horizon.
The property tax rate is 2%, the tax base is the average annual value of the property. For calculation see Appendix A Table A.5.
Table 8 summarizes current fixed costs. The operating company's variable costs are the railway tariff for transportation using its own rolling stock, taking into account the investment discount. Discounts and tariffs are calculated in the tariff section.
5 Tariff plan
Table 9 shows the current tariffs, and on the routes Surgut, Surgut-port, Vladivostok and Novorossiysk, tariffs for transportation by own rolling stock were calculated taking into account a 10 percent discount for routing.
Table 9 - Current tariffs by route (in US dollars per car)
| Transportation direction | Car type | Cargo | Rate | ||
| Art. departures | Art. appointments | Ministry of Railways | own p/s (gr.+por.) | ||
| Troitsk | Metallurgical | dump car | sand | 90 | 83 |
| Mechel | Metallurgical | dump car | granulated slag | 57 | 48 |
| Asphalt | Metallurgical | dispenser | crushed stone | 67 | 56 |
| Shartymka | Metallurgical | dispenser | crushed stone | 119 | 83 |
| Strawberry | Metallurgical | cement tanker | cement | 84 | 77 |
| Metallurgical | Surgut | gondola car | reinforced concrete | 368 | 281 |
| Metallurgical | Surgut-port | gondola car | Same | 368 | 281 |
| Metallurgical | Black Cape | gondola car | Same | 368 | 313 |
| Metallurgical | Ufa | gondola car | Same | 200 | 170 |
| Metallurgical | Tyumen | gondola car | reinforced concrete | 185 | 157 |
| Metallurgical | Orsk | gondola car | Same | 216 | 184 |
| Metallurgical | Magnitogorsk | gondola car | Same | 185 | 157 |
| Metallurgical | Surgut | platform | reinforced concrete | 368 | 281 |
| Metallurgical | Surgut-port | platform | Same | 368 | 281 |
| Metallurgical | Black Cape | platform | Same | 368 | 313 |
| Metallurgical | Ufa | platform | Same | 200 | 170 |
| Metallurgical | Tyumen | platform | Same | 185 | 157 |
| Metallurgical | Orsk | platform | Same | 216 | 184 |
| Metallurgical | Magnitogorsk | platform | Same | 185 | 157 |
| Metallurgical | Vladivostok | gondola car | ferrous metal rental | 2 951 | 2 258 |
| Metallurgical | Novorossiysk | gondola car | Same | 1 529 | 1 170 |
| Metallurgical | Samara | gondola car | Same | 652 | 554 |
| Metallurgical | Vologda | gondola car | Same | 1 021 | 868 |
| Metallurgical | Ryazan | gondola car | Same | 1 071 | 911 |
| Metallurgical | Moscow | gondola car | Same | 1 123 | 954 |
| Metallurgical | Rostov | gondola car | Same | 1 377 | 1 170 |
Due to the current conditions for calculating freight charges, the tariff for transportation in our own rolling stock, taking into account the return, is lower than the tariff for transportation by the Ministry of Railways fleet by 21%.
The investment discount is set as a percentage of the tariffs for loaded and empty trips and is calculated based on the intensity of use at the level of cars in the Russian Ministry of Railways fleet. The procedure for calculating investment tariffs is determined by the “Temporary procedure for establishing investment exclusive (reduced) tariffs for the transportation of goods in their own wagons owned by enterprises and organizations.”
The payback period during which the tariff discount is valid is assumed to be 5 years. The discount rate is set at 0.12. Table 10 presents the values of the weighted average discount by type of wagon (weight is the annual freight charge for wagons operating that year).
Table 10 - Weighted average discount by type of car (in percent)
| Car type | Weighted average discount | |||||||
| 2003 | 2004 | 2005 | 2006 | 2007 | 2008 | 2009 | 2010 | |
| Gondola car | 7,0 | 7,7 | 8,4 | 9,2 | 10,0 | 3,7 | 2,9 | 2,1 |
| Platform | 10,2 | 11,2 | 12,3 | 13,3 | 14,5 | 5,2 | 4,2 | 3,2 |
| Dumpcar | 14,5 | 15,9 | 17,4 | 18,6 | 20,4 | 7,5 | 6,1 | 4,5 |
| Dispenser | 22,2 | 24,5 | 26,8 | 29,2 | 31,7 | 11,5 | 9,1 | 6,4 |
| Cement tanker | 19,2 | 20,9 | 22,9 | 25,0 | 27,2 | 9,6 | 8,6 | 6,1 |
For a detailed calculation of the annual freight charge based on the intensity of use of own cars at the level of cars in the Russian Ministry of Railways fleet and discounts for cars put into operation by year of project implementation, see Appendix A of Table A.6-A.11.
Table 11 presents a comparative assessment of the annual freight charge for transportation by the Ministry of Railways fleet, its own rolling stock and the operating company’s fleet, taking into account the investment discount by year of project implementation.
Table 11 - Comparative assessment of the annual freight charge (in US dollars)
Table 12 presents a comparative assessment of tariffs for transportation by the Ministry of Railways fleet, its own rolling stock and the operating company’s fleet, taking into account the investment discount by year of project implementation. Table 13 presents rental rates for freight cars in the inventory fleet of the Russian federal railway transport.
Table 12 - Comparative assessment of tariffs by railcar fleet (in US dollars per railcar)
|
Transportation direction |
Car type | Cargo | Rate | |||||||
| Ministry of Railways | own p/s (gr.+por.) | |||||||||
| Art. departures | Art. appointments | 2003 | 2004 | 2005 | 2006 | 2007 | ||||
| Troitsk | Metallurgical | dump car | sand | 90 | 83 | 71 | 70 | 69 | 68 | 66 |
| Mechel | Metallurgical | dump car | granulated slag | 57 | 48 | 41 | 40 | 39 | 39 | 38 |
| Asphalt | Metallurgical | dispenser | crushed stone | 67 | 56 | 44 | 43 | 41 | 40 | 38 |
| Shartymka | Metallurgical | dispenser | crushed stone | 119 | 83 | 64 | 62 | 61 | 59 | 57 |
| Strawberry | Metallurgical | cement tanker | cement | 84 | 77 | 62 | 61 | 59 | 58 | 56 |
| Metallurgical | Surgut | gondola car | reinforced concrete | 368 | 281 | 262 | 260 | 258 | 255 | 253 |
| Metallurgical | Surgut-port | gondola car | Same | 368 | 281 | 262 | 260 | 258 | 255 | 253 |
| Metallurgical | Black Cape | gondola car | Same | 368 | 313 | 291 | 288 | 286 | 284 | 281 |
| Metallurgical | Ufa | gondola car | Same | 200 | 170 | 158 | 157 | 156 | 155 | 153 |
| Metallurgical | Tyumen | gondola car | Same | 185 | 157 | 146 | 145 | 144 | 143 | 141 |
| Metallurgical | Orsk | gondola car | Same | 216 | 184 | 171 | 170 | 168 | 167 | 166 |
| Metallurgical | Magnitogorsk | gondola car | Same | 185 | 157 | 146 | 145 | 144 | 143 | 141 |
| Metallurgical | Surgut | platform | Same | 368 | 281 | 253 | 250 | 247 | 244 | 241 |
| Metallurgical | Surgut-port | platform | Same | 368 | 281 | 253 | 250 | 247 | 244 | 241 |
| Metallurgical | Black Cape | platform | Same | 368 | 313 | 281 | 277 | 274 | 271 | 267 |
| Metallurgical | Ufa | platform | Same | 200 | 170 | 153 | 151 | 149 | 148 | 146 |
| Metallurgical | Tyumen | platform | Same | 185 | 157 | 141 | 139 | 138 | 136 | 134 |
| Metallurgical | Orsk | platform | Same | 216 | 184 | 165 | 163 | 161 | 159 | 157 |
| Metallurgical | Magnitogorsk | platform | Same | 185 | 157 | 141 | 139 | 138 | 136 | 134 |
Continuation of Table 12 (in US dollars per car)
|
Transportation direction |
Car type | Cargo |
Rate |
|||||||
| Ministry of Railways | own p/s (gr.+por.) | operating company taking into account investment discount (gr.+por.) | ||||||||
| Art. departures | Art. appointments | 2003 | 2004 | 2005 | 2006 | 2007 | ||||
| Metallurgical | Vladivostok | gondola car | ferrous metal rental | 2 951 | 2 258 | 2 100 | 2 083 | 2 067 | 2 050 | 2 033 |
| Metallurgical | Novorossiysk | gondola car | Same | 1 529 | 1 170 | 1 088 | 1 079 | 1 071 | 1 062 | 1 053 |
| Metallurgical | Samara | gondola car | Same | 652 | 554 | 515 | 511 | 507 | 503 | 499 |
| Metallurgical | Vologda | gondola car | Same | 1 021 | 868 | 807 | 801 | 794 | 788 | 781 |
| Metallurgical | Ryazan | gondola car | Same | 1 071 | 911 | 847 | 840 | 834 | 827 | 820 |
| Metallurgical | Moscow | gondola car | Same | 1 123 | 954 | 887 | 881 | 874 | 867 | 859 |
| Metallurgical | Rostov | gondola car | Same | 1 377 | 1 170 | 1 088 | 1 080 | 1 071 | 1 063 | 1 054 |
Table 13 - Rental rates
6 Financial plan
6.1 General characteristics of the calculations performed
Calculations were carried out for a period of 5.5 years (second half of 2002 - 2007). Calculations were carried out in US dollars; the project adopted an exchange rate of 1 dollar - 31 rubles. An assumption was made about the uniform and constant nature of inflation; calculations were carried out in base prices at a discount rate that does not take inflation into account. Discounting was carried out at a rate of 30%, taking into account the risk. The rate was calculated according to the Fisher formula (1), the loan rate was taken as a basis - 25%, and the risk was also taken into account - 4% (in accordance with the “Methodological recommendations for assessing investment projects in railway transport”, the value of the risk adjustment for investments in reliable equipment is 3-5%).
(1 +i BR) = (1 + i N) × (1 + r) (1)
Where i BR— discount rate - gross rate, in shares;
i N— base rate - net rate, in shares;
r— risk adjustment, in shares.
The income tax rate is 24%, the unified social tax is 35.6%, the property tax is 2%, value added tax was not taken into account according to the “Methodological recommendations for the assessment of investment projects in railway transport”. Calculations were performed using Microsoft Excel.
6.2 Funding strategy
At the stage of enterprise creation (2nd half of 2002), financial support for the project is carried out at the expense of the own funds of the cargo-forming enterprise - the founder of the operating company - CJSC "XXX" in the amount of 3,400,000 dollars and through a bank loan in the amount of 3,400. 000 dollars. The loan is taken out for 2 years at a rate of 25% per annum with quarterly interest payments. Repayment of the principal debt begins 1 year after receiving the loan: at the end of the first year, 50% of the amount of the loan received is repaid, at the end of the second year the balance of the debt is paid. In subsequent years, the project is financed from the profit received by the operating company.
6.3 Forecast financial documents
Based on data on the volumes and directions of transportation, tariffs in the corresponding directions, rental rates for freight cars of the inventory fleet of the federal railway transport of Russia, current fixed expenses of the operating company, loan payment amounts and tax rates, forecast financial documents were generated: income statement and losses and cash flow budget for the second half of 2002 and for 2003 - quarterly, then - by year; balance sheet of the enterprise at the time of creation of the operating company and at the end of each year of the project.
The forecast profit and loss statement is presented in Table 14. Revenue from transportation was calculated based on Ministry of Railways tariffs for transportation using its own rolling stock without taking into account discounts for routing (since the route is formed by the operating company, and enterprises usually send their products by carload or groups of cars ) and investment discounts and based on rental fees for the use of wagons. The cost of transportation includes the railway tariff that the operating company pays to the Ministry of Railways, depreciation of its own rolling stock and the costs of current and depot repairs of cars. Commercial and administrative expenses are wages of employees, unified social tax with payroll and rent for the office of the operating company. Profit in 2003 for the purpose of calculating income tax is reduced by the amount of losses incurred in 2002. The average annual net profit is 3,105,339 US dollars.
The cash flow budget is presented in table 15. Paid overhead costs are the costs of current and depot repairs. The line “for payment of administrative and commercial expenses” includes wages and office rent. Payments to the budget consist of paying a single social tax, property tax and income tax.
The forecast balance is presented in Table 16.
Table 14 - Forecast income statement (in US dollars)
| Indicator name | 2002 | 2003 | 2004 | 2005 | 2006 | 2007 | ||||
| III quarter | IV quarter | I quarter | II quarter | III quarter | IV quarter | |||||
| Revenue from transportation | - | - | 4 456 614 | 4 456 614 | 4 456 614 | 4 456 614 | 20 776 425 | 23 727 573 | 26 709 333 | 29 662 718 |
| Cost of transportation | - | - | 3 545 505 | 3 545 505 | 3 545 505 | 3 545 505 | 16 398 349 | 19 015 252 | 20 805 128 | 23 329 954 |
| Selling and administrative expenses | 16 308 | 16 308 | 16 308 | 16 308 | 16 308 | 16 308 | 65 232 | 65 232 | 65 232 | 65 232 |
| Profit from business activities | - 16 308 | - 16 308 | 894 801 | 894 801 | 894 801 | 894 801 | 4 312 844 | 4 647 089 | 5 838 974 | 6 267 532 |
| Loan interest | - | - | 212 500 | 212 500 | 212 500 | 212 500 | 425 000 | - | - | - |
| Profit from financing activities | - | - | - 212 500 | - 212 500 | - 212 500 | - 212 500 | - 425 000 | - | - | - |
| Profit of the reporting period | - 16 308 | - 16 308 | 682 301 | 682 301 | 682 301 | 682 301 | 3 887 844 | 4 647 089 | 5 838 974 | 6 267 532 |
| Income tax | - | - | 161 795 | 161 795 | 161 795 | 161 795 | 933 083 | 1 115 301 | 1 401 354 | 1 504 208 |
| Property tax | 16 831 | 16 831 | 32 562 | 32 562 | 32 562 | 32 562 | 130 496 | 128 473 | 124 294 | 110 365 |
| - 33 139 | - 33 139 | 487 943 | 487 943 | 487 943 | 487 943 | 2 824 265 | 3 403 315 | 4 313 326 | 4 652 959 | |
| Net profit on an accrual basis | - 33 139 | - 66 277 | 421 666 | 909 610 | 1 397 553 | 1 885 497 | 4 709 762 | 8 113 077 | 12 426 402 | 17 079 362 |
Table 15 - Cash flow budget (in US dollars)
| Indicator name | 2002 | 2003 | 2004 | 2005 | 2006 | 2007 | ||||
| III quarter | IV quarter | I quarter | II quarter | III quarter | IV quarter | |||||
| 1. Cash balance at the beginning of the period | - | 732 | 1 464 | 729 846 | 1 458 227 | 1 664 511 | 170 796 | 1 343 725 | 4 853 906 | 9 517 278 |
| 2. Total funds received: | 3 400 000 | 3 400 000 | 4 456 614 | 4 456 614 | 4 456 614 | 4 456 614 | 20 776 425 | 23 727 573 | 26 709 333 | 29 662 718 |
| including | ||||||||||
| transportation revenue | - | - | 4 456 614 | 4 456 614 | 4 456 614 | 4 456 614 | 20 776 425 | 23 727 573 | 26 709 333 | 29 662 718 |
| getting a loan | 3 400 000 | |||||||||
| proceeds from founders | 3 400 000 | |||||||||
| 3. Total funds sent: | 3 399 268 | 3 399 268 | 3 728 232 | 3 728 232 | 4 250 329 | 5 950 329 | 19 603 496 | 20 217 392 | 22 045 962 | 23 428 008 |
| including | ||||||||||
| to pay for railway tariff | - | - | 3 272 396 | 3 272 396 | 3 272 396 | 3 272 396 | 15 136 459 | 17 146 921 | 19 115 998 | 21 030 781 |
| to pay overhead costs | - | - | 32 671 | 32 671 | 32 671 | 32 671 | 150 968 | 605 658 | 261 342 | 717 423 |
| for payment of administrative and commercial expenses | 12 484 | 12 484 | 12 484 | 12 484 | 12 484 | 12 484 | 49 935 | 49 935 | 49 935 | 49 935 |
| to pay for purchased wagons | 1 324 194 | 1 324 194 | 205 161 | 205 161 | 418 710 | 454 194 | 424 516 | - | ||
| to pay for the overhaul of wagons | 2 041 935 | 2 041 935 | 316 935 | 316 935 | 643 548 | 701 613 | 653 226 | - | ||
| to pay for major repairs of wagons | ||||||||||
| to pay off debt on loans | 1 700 000 | 1 700 000 | - | - | - | |||||
| to pay interest on the loan | 212 500 | 212 500 | 212 500 | 212 500 | 425 000 | - | - | - | ||
| for budget calculations | 20 655 | 20 655 | 198 182 | 198 182 | 198 182 | 198 182 | 1 078 875 | 1 259 071 | 1 540 944 | 1 629 869 |
| 4. Cash balance at the end of the period | 732 | 1 464 | 729 846 | 1 458 227 | 1 664 511 | 170 796 | 1 343 725 | 4 853 906 | 9 517 278 | 15 751 988 |
Table 16 - Forecast balance (in US dollars)
| Article title | Reporting date | ||||||
| At the time of registration, c.-o. | At the end of 2002 | At the end of 2003 | At the end of 2004 | At the end of 2005 | At the end of 2006 | At the end of 2007 | |
| Assets | |||||||
| I. Non-current assets | |||||||
| Fixed assets | - | 6 732 258 | 6 814 700 | 6 766 037 | 6 659 171 | 6 309 124 | 4 727 373 |
| Total for Section I | - | 6 732 258 | 6 814 700 | 6 766 037 | 6 659 171 | 6 309 124 | 4 727 373 |
| II. Current assets | |||||||
| Cash | 3 400 000 | 1 464 | 170 796 | 1 343 725 | 4 853 906 | 9 517 278 | 15 751 988 |
| Total for Section II | 3 400 000 | 1 464 | 170 796 | 1 343 725 | 4 853 906 | 9 517 278 | 15 751 988 |
| Total assets | 3 400 000 | 6 733 723 | 6 985 497 | 8 109 762 | 11 513 077 | 15 826 402 | 20 479 362 |
| Passive | |||||||
| III. Capital and reserves | |||||||
| Authorized capital | 3 400 000 | 3 400 000 | 3 400 000 | 3 400 000 | 3 400 000 | 3 400 000 | 3 400 000 |
| Retained earnings from previous years | - | - | - | 1 885 497 | 4 709 762 | 8 113 077 | 12 426 402 |
| Retained earnings of the reporting year | X | - | 1 885 497 | 2 824 265 | 3 403 315 | 4 313 326 | 4 652 959 |
| Uncovered loss of the reporting year | X | 66 277 | - | - | - | - | - |
| Total for Section III | 3 400 000 | 3 333 723 | 5 285 497 | 8 109 762 | 11 513 077 | 15 826 402 | 20 479 362 |
| IV. long term duties | |||||||
| Total for Section IV | - | - | - | - | - | - | - |
| V. Current liabilities | - | - | - | - | - | ||
| Bank loans | - | 3 400 000 | 1 700 000 | - | - | - | - |
| Total for Section V | - | 3 400 000 | 1 700 000 | - | - | - | - |
| Total liabilities | 3 400 000 | 6 733 723 | 6 985 497 | 8 109 762 | 11 513 077 | 15 826 402 | 20 479 362 |
6.4 Analysis of financial ratios
Financial ratios calculated on the basis of data from forecast financial documents are presented in Table 17. The analysis of financial ratios showed that by the end of 2003 the enterprise became financially stable, and by the end of 2004 - absolutely liquid. The amount of economic assets is constantly increasing, this happens mainly due to cash. The share of fixed assets is gradually decreasing, the depreciation rate of fixed assets is increasing, which, in general, is natural - the time for major repairs of cars purchased in 2002 is approaching. The return and return on capital ratios first increase, but then tend to decrease, because accumulation of own funds occurs. The return and profitability ratios of OPF are constantly growing. The average profitability of sales is 21%, the average profitability of transportation is 26%.
Taking all this into account, we can draw a conclusion about the financial viability of the project.
6.5 Break-even analysis
Break-even analysis showed that the company has a large margin of financial strength (much more than the desired 10% of revenue). The results of the break-even analysis are presented in Fig. 1.
Table 17 - Financial ratios
| Indicator name | Reporting date | ||||||
| At the time of registration, c.-o. | At the end of 2002 | At the end of 2003 | At the end of 2004 | At the end of 2005 | At the end of 2006 | At the end of 2007 | |
| Assessment of property status | |||||||
| Amount of household assets, $ | 3 400 000 | 6 733 722 | 6 985 496 | 8 109 762 | 11 513 076 | 15 826 402 | 20 479 361 |
| Cost of fixed assets, $ | - | 6 732 258 | 6 814 700 | 6 766 037 | 6 659 171 | 6 309 124 | 4 727 373 |
| Share of fixed assets in assets | - | 0,9998 | 0,98 | 0,83 | 0,58 | 0,40 | 0,23 |
| Depreciation rate of fixed assets | 0 | 0 | 0,12 | 0,23 | 0,33 | 0,43 | 0,57 |
| Fixed asset commissioning ratio | 1 | 0,15 | 0,16 | 0,17 | 0,17 | - | |
| Fixed asset retirement ratio | 0 | 0 | 0 | 0 | 0 | 0 | 0 |
| Liquidity assessment | |||||||
| Own working capital (SOS), $ | 3 400 000 | 1 464 | 170 796 | 1 343 725 | 4 853 906 | 9 517 278 | 15 751 988 |
| SOS maneuverability | 1 | 1 | 1 | 1 | 1 | 1 | 1 |
| General liquidity ratio | ∞ | 0,001 | 0,3 | ∞ | ∞ | ∞ | ∞ |
| SOS security ratio | 1 | 1 | 1 | 1 | 1 | 1 | 1 |
| Share of working capital in assets | 1 | 0,0002 | 0,02 | 0,17 | 0,42 | 0,60 | 0,77 |
| Coverage Index % - TIE | - | - | 16,84 | 40,59 | - | - | - |
| Financial stability assessment | |||||||
| Financial Independence Ratio | 1 | 0,5 | 0,8 | 1 | 1 | 1 | 1 |
| Financial dependency ratio | 1 | 2 | 1,3 | 1 | 1 | 1 | 1 |
| Equity agility ratio | 1 | 0,0004 | 0,03 | 0,17 | 0,42 | 0,60 | 0,77 |
| Debt to equity ratio | 0 | 1,02 | 0,32 | 0 | 0 | 0 | 0 |
| Financial stability ratio | 1 | 1 | 1 | 1 | 1 | 1 | 1 |
| Business activity assessment | |||||||
| Capital productivity (see also how to determine capital productivity) | 0 | 2,74 | 3,18 | 3,69 | 4,30 | 5,38 | |
| Return on equity | 0 | 4,14 | 3,10 | 2,42 | 1,95 | 1,63 | |
| Total capital productivity | 0 | 2,60 | 2,75 | 2,42 | 1,95 | 1,63 | |
| Working capital turnover, times | 0 | 207 | 27 | 8 | 4 | 2 | |
| Profitability assessment | |||||||
| Return on sales | 0 | 0,20 | 0,21 | 0,20 | 0,22 | 0,21 | |
| Profitability of transportation | 0 | 0,25 | 0,26 | 0,24 | 0,28 | 0,27 | |
| Return on equity | 0 | 0,45 | 0,42 | 0,35 | 0,32 | 0,26 | |
| Return on assets | 0 | 0,28 | 0,37 | 0,35 | 0,32 | 0,26 | |
| Profitability of OPF | 0 | 0,30 | 0,43 | 0,53 | 0,69 | 0,84 | |
6.6 Economic assessment of the project
A positive balance of accumulated real money is ensured in all billing periods, which is a condition for the feasibility of the project. The effectiveness of the project is characterized by the following indicators: the discounted payback period of the PP project is 4.1 years, which is less than 5.5 years - the calculation horizon; net present value NPV - 2,335,441 US dollars (more than 0); internal rate of return IRR - 50% - greater than the discount rate equal to 30%; profitability index PI - 1.14 (more than 1). All this speaks to the economic efficiency of the project.
The NPV calculation is presented in Table 18, the PI calculation is presented in Table 19.
For calculation of the project's discounted payback period and internal rate of return, see Appendix A.
So, based on all of the above, we can draw a conclusion about the investment attractiveness of this business project.
We can only advise XXX CJSC not to delay the implementation of the project while the market for operator services has not yet been completely divided and there are good prospects for expanding this business. Also, it is recommended not to accumulate your own funds, but to make your money work. But this will be the subject of another business plan.
Table 18 - NPV calculation (in US dollars)
| Data name | Year | |||||
| 2nd floor 2002 | 2003 | 2004 | 2005 | 2006 | 2007 | |
| Capital investments | 6 732 258 | 1 044 194 | 1 062 258 | 1 155 806 | 1 077 742 | - |
| Marginal profit | ||||||
| from transportation of JSC "XXX" | 1 531 765 | 1 823 465 | 2 122 282 | 2 460 764 | 2 799 842 | |
| from transportation to third parties | 3 205 105 | 3 816 501 | 4 458 370 | 5 132 571 | 5 832 095 | |
| Current fixed costs k.-o. | 32 616 | 1 157 667 | 1 327 121 | 1 933 563 | 1 754 362 | 2 364 406 |
| incl. depreciation | - | 961 751 | 1 110 922 | 1 262 673 | 1 427 788 | 1 581 751 |
| Getting a loan | 3 400 000 | |||||
| Loan payments | ||||||
| interest | 850 000 | 425 000 | ||||
| main debt | 1 700 000 | 1 700 000 | ||||
| Profit before tax | - 32 616 | 2 729 204 | 3 887 844 | 4 647 089 | 5 838 974 | 6 267 532 |
| Income tax | - | 647 181 | 933 083 | 1 115 301 | 1 401 354 | 1 504 208 |
| Property tax | 33 661 | 130 249 | 130 496 | 128 473 | 124 294 | 110 365 |
| Net profit of the reporting period | - 66 277 | 1 951 774 | 2 824 265 | 3 403 315 | 4 313 326 | 4 652 959 |
| Cash flows | - 3 398 535 | 169 332 | 1 172 929 | 3 510 181 | 4 663 372 | 6 234 711 |
| Discount coefficient | 1,000 | 0,769 | 0,592 | 0,455 | 0,350 | 0,269 |
| Discounted cash flows | - 3 398 535 | 130 255 | 694 041 | 1 597 716 | 1 632 776 | 1 679 189 |
| Net present value (NPV) | - 3 398 535 | - 3 268 280 | - 2 574 240 | - 976 524 | 656 252 | 2 335 441 |
Table 19 - Calculation of the profitability index - PI (cash flows in US dollars)
A business focused on large deliveries is bound to face the issue of delivery. Selecting, ordering, paying for a product is one thing, but it still needs to be delivered to the country, across the country and to retail outlets. And for this you need transport. Which transport is profitable to use for certain goods and how to choose a transport company, we will consider the question today with logistics specialists.
Benefit for business: railway transportation - choose a transport company
In order for the goods to travel a long distance from the seller to the buyer, and then to the end consumer, you can use railway transportation, road transport or air travel.
![]()
Advantages
About 85% of all transportation occurs by rail, and this is not without reason. Rail delivery has many advantages:
- availability;
- the ability to transport various types of cargo;
- does not depend on the weather;
- possibility of using universal or special cars and tanks.
- optimal price, cheaper than the other two types of delivery (road and plane);
- Transportation of various types of cargo: raw materials, cars and heavy equipment, mining and agricultural products, equipment, special and dangerous goods.
![]()
Types of transportation
The services that a transport company can offer for the delivery of goods are varied:
- Transportation of small loads up to 10 tons. In this case, the cargo should not occupy more than a third of the car.
- Transportation of small-tonnage cargo – 10-20 tons. The volume of cargo in this case can reach from half to a whole car.
- Transportation of a group of goods. Goods can occupy more than 1 wagon and are used for transportation and unloading in one place for the entire group.
- Delivery by routes. The cargo is distributed and prepared so that it can be delivered to different unloading locations.
- Transportation by containers. The most convenient, modern and popular type of railway transportation.
![]()
Choosing a company
In addition to selecting the type of transportation, it is important to choose a transport company that will provide quality services. A railway transportation company must have been operating for a long time and have proven itself well in this service sector. Also pay attention to clients; if among them there are well-known companies, then this is an additional plus in favor of the company, confirming its professionalism.
![]()
Of course, today the freight turnover of railways is somewhat reduced in favor of motor transport, and passenger turnover - in favor of air transport. However, for remote areas, railway transportation still remains one of the most cost-effective types of cargo delivery, which makes this area profitable for commercial activities. You can see an example of a company from which you can order a service for rail transportation of goods.
To conduct activities related to the organization of railway freight transportation, it is imperative to familiarize yourself with the rules of regulations Ministry of Railways ( Ministry of Railways) regulating aspects of the industry. Such documents in particular are:
- Rules for the carriage of goods,
- Technical conditions for loading and securing cargo,
- Rules for the transportation of goods in direct mixed rail-water and rail-road traffic,
- Rules for the transportation of export-import cargo.
- Weighing accuracy standards;
- Delivery times of goods;
- Cargo storage rules;
- Rules for the transfer and redirection of goods;
- Rules for submission and consideration of claims.
All of them have the force of law and are binding on railroads, shippers and consignees.
Development of railway transportation
While starting a rail transportation business is a relatively simple matter, making the company successful and very profitable can actually be quite difficult. Even taking into account the great demand for the service among entrepreneurs and individuals, high competition makes itself felt.
The only condition under which your company can develop steadily is to work on a profitable offer for the client. Ultimately, there are always companies on the market that are able to offer the client the BEST service in some important aspects: price/time/quality.
Remember Marketing , which needs to be given maximum attention - a queue of clients wishing to use the company's services - the key to the success of any business.


Popular
- Yandex contextual advertising system
- How much do bloggers earn on YouTube and Instagram in Russia? How to make money as a blogger on YouTube
- Native advertising: cases Native advertising in Yandex
- How to make money without doing anything How to make money you can do nothing
- How to make money by making and selling homemade pies
- Earn money quickly with a CPA affiliate for Infobusiness
- Earn money online with binary options
- Methodological development of a quiz lesson on the profession of "sewing equipment operator"
- Success story of Zakhar Smushkin - founder of the largest pulp and paper company Ilim Other projects of Zakhar Davidovich
- How to sell unnecessary things on the Internet?