How is the break-even point calculated? The break-even point is determined by analyzing the ratio of indicators, how to calculate sales volume
Break even- the most important indicator for an entrepreneur, since it indicates the fact that the company is becoming profitable. How to determine when a company reaches the break-even point?
Determining the break-even point
The break-even point is an indicator, or more precisely, a tandem of 2 indicators: the volume of production and the volume of revenue from its sales, reflecting the adequacy of the corresponding values in terms of covering current costs. Sometimes it is also called the critical point. Both indicators—production volume and revenue volume—are equally significant and therefore are used inextricably by economists.
What does the break-even point show?
The break-even point (a combination of its components) shows the reporting period at the end of which the company made a profit. Depending on the further dynamics of sales and the volume of production of goods, the company can increase profits, or, conversely, reduce them and thus fail to achieve the break-even point. That is, the break-even point is a dynamic indicator. But a successful enterprise, once achieved, usually stays there in the future.
The timing of reaching the break-even point of a business project is the most important indicator for an entrepreneur, investor, partner, and lender. Any of them expects to quickly reach the point when the business will begin to make a profit, and also expects that the company will further develop with positive dynamics in revenue and volume of goods produced, combined with optimal costs.
What data is needed to determine the break-even point?
In order to calculate the break-even point, you will need:
- indicators reflecting the volume of production and sales of goods (or services provided) in units (OPP);
- indicators reflecting the selling price of 1 unit of products or services (OP);
- indicators reflecting the costs of producing 1 unit of products or services (RP);
- indicators reflecting the amount of fixed costs (PR);
- indicators reflecting the amount of dynamic costs (DR);
- indicators reflecting revenue (B).
Each of the marked indicators is taken into account for the same reporting period, for example a month. The break-even point determined for one reporting period may remain unchanged for subsequent periods - if the indicators of the selling price, fixed and variable expenses do not change.
Indicators for the first point can be expressed in pieces, tons and other units of measurement.
The selling price of 1 unit of goods or services provided is expressed in rubles or other currency in which they are sold.
The costs of producing 1 unit of goods or services are also expressed in rubles. Their structure may include purchasing costs, costs of materials, raw materials, and licensing fees. The corresponding figures are calculated as a result of dividing the indicator for dynamic costs (DR) by the indicator for production and sales volumes (OPV).
Fixed expenses are those that do not depend on the current levels of output of goods and services. For example, these could be expenses for salaries, utilities, and rent.
Dynamic expenses are the result of the product of the RP and OPP indicators or an independent indicator (on the basis of which, as we noted above, the RP can be calculated). They increase or decrease depending on the dynamics of production and sales costs.
Revenue is the result of the product of the PV and OPP indicators. It increases or decreases depending on these indicators.
Break-even point formula in monetary terms
In order to calculate the break-even point in monetary terms, that is, by revenue, you need:
1. Divide the indicator of dynamic expenses (DR), defined as the product of OPP and RP or as an independent indicator, by a figure reflecting the volume of production and sales of goods or services (OCP).
2. Subtract the resulting amount from the total cost.
3. Divide the resulting value by the OT.
4. Divide the indicators reflecting the amount of fixed expenses (PR) by the number obtained in point 3.
The formula for calculating the revenue break-even point (TBV) will look like this:
TBV = PR / (OTs - DR/OPP) /OTs,
Let's consider another option for determining the break-even point - based on the volume of production and sales of goods or services.
An example of calculating the break-even point for the volume of production and sales of goods
The algorithm for calculating this indicator is very similar to the one we discussed above. Necessary:
1. Divide the dynamic cost indicator (DR) by the amount reflecting the volume of production and sales of goods or services (OPS).
2. Subtract the resulting value from the OT.
3. Divide the indicators reflecting the amount of fixed expenses (PR) by the amount obtained in point 3.
The break-even point formula for production and sales volumes (MSW) will look like this:
MSW = PR / (OTs - DR/OPP),
where DR = OPP × RP (or an independent indicator).
It is very convenient to carry out such calculations in an Excel spreadsheet. Let's consider the main features of using this method of determining the break-even point.
Break-even point formula in Excel: why is it convenient?
Excel is a spreadsheet in which you can place data provided that you build mathematical relationships between them. Therefore, Excel is one of the most convenient tools for calculating the break-even point. Using the formulas of this program, you can build a table in which the indicator in question will be determined in dynamics corresponding to changes in those figures that reflect revenue, expenses and the selling price of goods and services, which we mentioned above.
How to calculate the break-even point in Excel?
To calculate the break-even point in Excel, you must first create a table in the structure of which the necessary formulas will be presented. The syntax of Excel allows you to almost completely reproduce the calculations that we discussed above.
It is necessary to create a table consisting of 6 rows that correspond to:
- indicators for the volume of production and sales of goods (or services provided) in units (OPP);
- indicators for the selling price of 1 unit of products or services (OP);
- indicators for the cost of producing 1 unit of products or services (RP);
- indicators for the amount of fixed expenses (PR);
- indicators based on the value of dynamic costs (DR);
- indicators in terms of revenue (B).
In the first column of the table, with the help of which the break-even point will be calculated, you can place a list of marked indicators (for example, if this is column B, then they will be placed, respectively, in cells B1, B2, B3, etc.). In the second, indicate the numbers corresponding to them. If this is column C, then the cell structure will be like this:
- C1 - figures for production and sales volumes;
- C2 - figures for the selling price of 1 unit of products or services;
- C3 - figures for the costs of producing 1 unit of products or services;
- C4 - figures for fixed costs;
- C5 - figures for dynamic costs;
- C6 - revenue figures.
In the 7th and 8th rows of the table, you can select cells - in any convenient place - in which the break-even point will be determined, respectively, by revenue and by production and sales volumes.
In the first case, you must enter a formula of the form in the corresponding cell:
C4 / ((C2 - C5 / C1) / C2).
After that, it will reflect the break-even point for revenue.
In the second case, the formula will look like this:
C4/(C2 - C5/C1).
The corresponding cell will display the break-even point for production and sales volumes.
Note that the formulas we discussed above for calculating the break-even point do not include cell C6, in which revenue figures are recorded. However, it is useful from the point of view of a visual comparison of current revenue and that corresponding to the break-even point.
However, the number in cell C6 is dynamic. In order for it to be displayed in the table, you need to enter a formula like this in the appropriate cell:
If the break-even point is greater than revenue, it means that the company made a profit in the corresponding reporting period.
If necessary, you can also create tables for several reporting periods - their structure will be identical to the table that we have considered, and then use the built-in Excel tools to build graphs for achieving the break-even point - for example, in correlation with revenue or production and sales volumes.
Calculation and chart of break-even point online: available tools
Our experts suggest you make your task much easier and use ready-made tools to calculate your break-even point online. You can download it right now from the links below:
- a document in Excel format containing a ready-made table for calculating the break-even point for revenue, as well as production and sales volumes;
- a document in Excel format containing a ready-made table for determining the break-even point and supplemented by a graph reflecting the dynamics of achieving the corresponding indicators.
The documents we offer are thus optimized for work on calculating the break-even point in several reporting periods at once.
You can learn more about other useful indicators that characterize the effectiveness of an enterprise’s business model in the articles:
The break-even point reflects the volume of production, sales of goods and services, which covers all costs of the enterprise. In an economic sense, it is an indicator of a critical situation when profits and losses are zero. This indicator is expressed in quantitative or monetary units.
The lower the break-even point of production and sales volume, the higher the solvency and financial stability of the company.
Break-even point formula in Excel
There are 2 ways to calculate the break-even point in Excel:
- In monetary terms: (revenue * fixed costs) / (revenue - variable costs).
- In natural units: fixed costs / (price – average variable costs).
Attention! Variable costs are taken on a per unit basis (not total).
To find breakeven, you need to know:
Fixed costs (not dependent on the production process or sales) - rent payments, taxes, salaries for management personnel, leasing payments, etc.
Variable costs (depending on production volumes) - the cost of raw materials and materials, utility bills in production premises, workers' salaries, etc.
Selling price per unit of goods.
Let's enter the data into an Excel table:
- Find the volume of production at which the company will receive a net profit. Establish the relationship between these parameters.
- Calculate the volume of sales of goods at which the break-even point will occur.
To solve these problems, we compose the following table with formulas:
- Variable costs depend on the volume of products produced.
- Total costs are the sum of variable and fixed costs.
- Income is the product of production volume and product price.
- Contribution margin is total revenue minus variable costs.
- Net profit is income without fixed and variable production costs.
Let’s fill out the table and see at what output the enterprise will be “in the black.”

Starting from the 13th production, net profit became positive. And at the break-even point it equals zero. Production volume – 12 units of goods. And the income from sales is 120,000 rubles.
How to graph the break-even point in Excel
To clearly demonstrate the economic and financial condition of the enterprise, we will draw up a graph:
- We decide on the appearance of the graph and click the “Select data” button.
- For demonstration, we need the columns “Total Costs”, “Revenue”, “Net Profit”. These are the elements of the legend - “Rows”. We manually enter the “Row Name”. And in the “Values” line we make a link to the corresponding column with data.
- The range of horizontal axis labels is “Production Volume”.
We get a graph like:

Let's change the graph (chart layout) a little.

This demonstration allows us to see that the net profit at the break-even point is indeed “zero”. And it was after the twelfth release of the product that “plus” began.
Where are such calculations needed?
The “break-even point” indicator is in demand in economic practice to solve the following problems:
- Calculation of the optimal price for the product.
- Calculation of the amount of costs at which the company still remains competitive.
- Drawing up a product sales plan.
- Finding the volume of output at which profitability will appear.
- Analysis of the financial condition and solvency of the enterprise.
- Finding the minimum production volume.
Ready-made calculations and templates for analyzing an enterprise's break-even point.
It is known that the production of products implies investment in its production and sale. Every entrepreneur, intending to create good, pursues the goal of making a profit from the sale of goods/services. The break-even chart helps to see in value and physical terms the revenue and volume of production at which the profit is zero, but all costs have already been covered. Accordingly, having crossed the break-even point, each subsequent unit of good sold begins to bring profit to the enterprise.
Data for the graph
To draw up sequential actions and get an answer to the question: “How to build a break-even chart?” it requires an understanding of all the components needed to create a functional dependency.
All the company's costs for selling products are gross costs. Dividing costs into fixed and variable allows you to plan profits and is the basis for determining the critical volume.
Rent of premises, insurance premiums, depreciation of equipment, wages, management - these are the components of fixed costs. They are united by one condition: all listed expenses are paid regardless of production volumes.
The purchase of raw materials, transportation costs, wages of production personnel are elements of variable costs, the size of which is determined by the volume of goods produced.
Revenue is also the initial information for finding the break-even point and is expressed as the product of sales volume and price.
Analytical method
There are several ways to determine the critical volume. The break-even point can also be found using the analytical method, that is, through a formula. In this case, a schedule is not required.
Profit = Revenue – (Fixed expenses + Variable expenses * Volume)
The determination of break-even is carried out under the condition that the profit is zero. Revenue is the product of sales volume and price. This results in a new expression:
0 = Volume*Price – (Fixed costs + Variables * Volume),
After elementary mathematical procedures, the output is the formula:
Volume = Fixed costs / (Price – Variable costs).
After substituting the initial data into the resulting expression, the volume is determined that covers all the costs of the good being sold. You can go from the opposite, setting the profit not to zero, but to the target one, that is, the one that the entrepreneur plans to receive, and find the volume of production.
Graphical method
An economic tool such as a break-even chart is capable of predicting the main performance indicators of an enterprise, taking into account constant market conditions. Basic steps:
- The dependence of sales volumes on revenue and costs is constructed, where the X axis reflects data on volume in physical terms, and the Y axis shows revenue and costs in monetary terms.
- A straight line is constructed in the resulting system, parallel to the X axis and corresponding to fixed costs.
- The coordinates corresponding to variable costs are plotted. The straight line goes up and starts from zero.
- The straight line of gross costs is plotted. It is parallel to the variables and originates along the ordinate axis from the point from which the construction of fixed costs began.
- Construction in the system (X, Y) of a straight line characterizing the revenue of the analyzed period. Revenue is calculated on the condition that the price of products does not change during this period and output is produced evenly.

The intersection of direct revenues and gross expenses projected on the X-axis is the desired value - the break-even point. An example graph will be discussed below.
Example: how to build a break-even chart?
An example of constructing a functional relationship between sales volumes and revenues and costs will be produced using the Excel program.
The first thing you need to do is consolidate data on revenue, costs and sales volumes into a single table.

Next, you should call the “Graph with Markers” function through the toolbar using the “Insert” tab. An empty window will appear; right-click on the data range, which includes the cells of the entire table. The X-axis label changes through the selection of data related to the output volume. After that, in the left column of the “Select data source” window, you can delete the output volume, since it coincides with the X-axis. An example is shown in the figure.

If we project the point of intersection of direct revenues and gross costs onto the x-axis, then the volume of approximately 400 units is clearly determined, which characterizes the break-even of the enterprise. That is, having sold over 400 units of products, the company begins to operate in profit, receiving revenue.

Example using formula
The initial task data is taken from a table in Excel. It is known that production is cyclical and amounts to 150 units. The output corresponds to: fixed costs - 20,000 monetary units; variable expenses – 6000 den. units; revenue – 13,500 den. units It is necessary to calculate break-even.
- Determination of variable costs for the production of one unit: 6000 / 150 = 40 den. units
- Price of one sold good: 13,500 / 150 = 90 den. units
- In physical terms, the critical volume is: 20,000 / (90 - 40) = 400 units.
- In value terms, or revenue for this volume: 400 * 90 = 36,000 den. units
The break-even schedule and formula led to a unified solution to the problem - determining the minimum production volume that covers the cost of production. Answer: 400 units must be produced in order to cover all costs, the revenue will be 36,000.00 den. units
Limitations and conditions of construction
The simplicity of estimating the level of sales at which the costs of selling products are reimbursed is achieved through a number of assumptions made for the availability of the model. It is believed that production and market conditions are ideal (which is far from reality). The following conditions are accepted:
- Linear relationship between output and costs.
- The entire volume produced is equal to the volume sold. There are no stocks of finished products.
- Product prices do not change, and neither do variable costs.
- No capital costs associated with purchasing equipment and starting production.
- A specific time period is adopted during which the amount of fixed costs does not change.

Due to the above conditions, the break-even point, the example of which was considered, is considered a theoretical value in the projection of the classical model. In practice, calculations for multi-item production are much more complicated.
Disadvantages of the model
- Sales volume is equal to production volume and both quantities change linearly. Not taken into account: buyer behavior, new competitors, seasonality of release, that is, all conditions affecting demand. New technologies, equipment, innovations and others are also not taken into account when calculating production volumes.
- Finding a break-even position is applicable for markets with stable demand and low levels of competition.
- Inflation, which may affect the cost of raw materials and rent, is not taken into account when establishing one product price for the period of the break-even analysis.
- The model is inappropriate for use by small businesses whose product sales are unstable.
Practical use of the break-even point
After enterprise specialists, economists and analysts have made calculations and constructed a break-even chart, external and internal users obtain information to make decisions on the further development of the company and investment.

Main purposes of using the model:
- Calculation of product prices.
- Determining the volume of output that ensures the profitability of the enterprise.
- Determination of the level of solvency and financial reliability. The farther the output is from the break-even point, the higher the margin of financial strength.
- Investors and creditors - assessment of the development efficiency and solvency of the company.
Break even (break-even point) - a point on the break-even chart in the coordinates revenue-costs / months (period) or the volume of sales of products and services calculated by the formula equal to the volume of production at which the company’s expenses are compensated by its income. The production and sale of the subsequent product unit brings the company its first profit.
The economic meaning of the break-even point is revenue at which profit is zero or revenue can cover all the company’s fixed and variable costs. Reaching the break-even point means reaching the recoupment of the company's total costs.
Break-even point value:
- The break-even point shows from what amount received into the company's account the profit begins.
- knowledge of the break-even point can determine the minimum level of revenue below which production will not pay off;
- The break-even point indirectly shows below what price you cannot fall when selling a product.
Break-even point is calculated in units of production, in monetary terms or taking into account the expected profit margin. Classically, the break-even point, calculated from the number of units of production, assumes the recoupment of total costs.
Break-even point formula in monetary terms:
TB d = (V x W post) / (V - W lane)
Where:
TB d - break-even point in monetary terms;
B - sales revenue;
Z post - fixed costs;
Z lane - variable costs.
Break-even point in physical terms (in units of production):
TB n = Z lane / (C - Z sp)
Where:
Z lane - variable costs;
P - price per unit of production;
Z sp - average variable costs per unit of production.
There is a certain mutual influence and interdependence between costs, production volume and profit. It is known that, subject to all other conditions being equal, the growth rate of profits always exceeds the growth rate of product sales. With an increase in the volume of product sales, the share of fixed costs in the structure of product costs decreases and the “extra profit effect” appears.
How to determine the break-even point on a chart?It is necessary to build a profit graph for the period, in coordinates:
- horizontally – period control points (days of the month, months or years),
- vertically – revenue in rubles.
- also vertically – the company’s expenses for the same period in rubles.
The break-even point is the point at which the revenue line crosses and goes above the total (gross) cost line. If you plot the profit line on the same chart, then the break-even point will show the control point on the horizontal axis of the chart (period), where the profit line crosses 0 and moves from the loss zone to the profit zone.
Break-even analysis(CVP analysis - cost volume profit) or break even point (break point, break-even point in this case) shows what can happen to a company’s profit when the volume of production and (or) sales of products, services changes, prices and basic cost parameters change companies.
We will tell you about the break-even point of an enterprise, the formula and algorithm for calculating it in analytical and graphical form.
Enterprise break-even point(English CVP point) shows what the volume of production of goods and services, as well as their sales, should be in order to cover all costs and expenses. The break-even point can be expressed in the number of products produced, in monetary terms, or in the possible amount of future profit.
The break-even point indicator, like any financial indicator, should have an economic meaning. Thus, the break-even point serves as an indicator that shows what size of production of goods/services is critical for the enterprise, at which profits and losses are equal to zero. The break-even point is used to analyze the financial condition of an enterprise; the higher the production and sales volume above this critical point, the better its solvency and financial strength.
Model for calculating the break-even point of an enterprise
When calculating the break-even point, enterprises use the following assumptions and simplifications of reality:
- Product output and costs have a linear relationship (have a linear trend of change);
- Variable costs and product prices are constant over the future period under consideration;
- Production capacities are constant, the structure of products does not change;
- Inventories of finished products are not significant and will not distort the assessment of the enterprise’s break-even point. In other words, production equals sales;
- Variable costs can be predicted and accurately estimated in the future;
As we can see, the conditions for assessing the break-even point are ideal: stable market, production and organizational conditions. In reality, product output, sales and costs are influenced by many external factors that are difficult to predict in the planning period. Still, let’s consider an ideal model for calculating the break-even point of an enterprise.
Stages of calculating the break-even point according to A.D. Sheremet
Domestic economist A.D. Sheremet identified the main 3 stages to determine the break-even point of an enterprise.
- Collection of necessary information for analysis. Assessment of the level of production volume, product sales, profits and losses.
- Calculation of the size of variable and fixed costs, determination of the break-even point and safety zone.
- Assessing the required level of sales/production to ensure the financial sustainability of the enterprise.
The enterprise's task is to determine the lower limit of its financial stability and create opportunities to increase its safety zone.
Break even. 2 calculation formulas
Below are the formulas for calculating the break-even point of an enterprise. As a rule, they use the break-even point expressed in the volume of production and the monetary equivalent of the generated income.
Formula for calculating the break-even point of an enterprise in monetary terms
It should be noted that variable costs are calculated per unit of output, and not total.
Formula for calculating the break-even point of an enterprise in physical terms
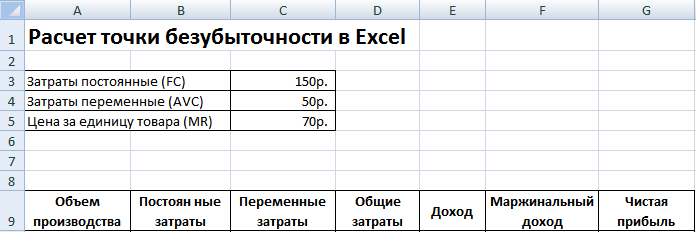
Example of calculating the break-even point in Excel
Fixed costs (FC)- These are costs that do not depend on production. For example, this could be rent for premises, leasing payments, taxes, salaries for administrative staff, etc.
Variable costs (AVC)- These are costs that vary depending on the volume of production. Variable costs include: costs of raw materials and supplies, energy payments, fuel, workers' wages, etc.
Unit price (MR)– represents the selling price of manufactured products.
Let's fill in the main indicators in Excel. Fixed costs are 150 rubles, variable costs are 50 rubles. and the selling price is 70 rubles. per unit of production.

Break even. Main settings
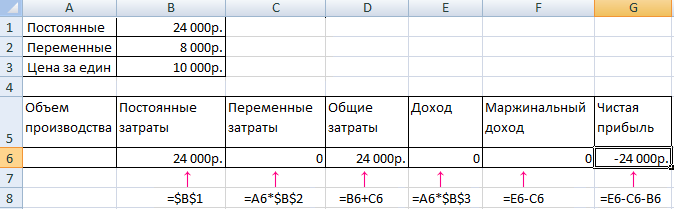
At the next step, we will calculate how the amount of net profit will change depending on production, and determine at what volume of product sales the break-even point will occur. Let's create a table with the following columns.
Column fixed costs= C3
Variable costs=A10*$C$4
Total costs = Variable + fixed costs= B10+C10
Income= A10*$C$5
Marginal income = Revenue - Variable costs = E10-C10
Net profit=E10-C10-B10

As we can see, starting from the 8th product, net profit became positive, and on the 7th product it was still negative. The break-even point is equal to a production volume of 8 pcs. and sales income of 560 rubles.
 |
★ (calculation of Sharpe, Sortino, Treynor, Kalmar, Modiglanca beta, VaR) + forecasting course movements |
For greater clarity, we present a graph of changes in the net profit of the enterprise depending on the volume of production/sales of products.

You can calculate and compare other calculated indicators, which are presented in the figure below. If the level of production/sales at the enterprise currently corresponds to 17 pcs. per month, the safety margin is 190 rubles.

Break-even point and practice of using it
Break-even point analysis is used for various purposes. Let's consider some directions and purposes of using this indicator. The table below shows the purposes of possible use of the break-even point indicator in economic practice.
| Users | Purpose of use |
|
Internal users |
|
| Development/Sales Director | Calculation of the optimal price per unit of goods, calculation of the level of costs when the enterprise can still be competitive. Calculation and preparation of a sales plan |
| Owners/Shareholders | Determining the volume of production at which the enterprise will become profitable |
| Financial analyst | Analysis of the financial condition of the enterprise and the level of its solvency. The further an enterprise is from the break-even point, the higher its threshold of financial reliability |
| Production Director | Determination of the minimum required volume of production at the enterprise |
|
External users |
|
| Creditors | Assessment of the level of financial reliability and solvency of the enterprise |
| Investors | Assessing the effectiveness of enterprise development |
| State | Assessing the sustainable development of an enterprise |
The use of the break-even point model is used in management decisions and allows you to give a general description of the financial condition of the enterprise, assess the level of critical production and sales to develop a set of measures to increase financial strength.
Advantages and disadvantages of the break-even point model
Let's consider the main advantages and disadvantages of the break-even point model.
The advantages of this model are the ease of analysis and assessment of the required level of production and sales when the minimum critical level is reached. The disadvantages of the model lie in the conditions and limitations of constructing this model.
- Linearity of changes in production and sales volumes. This does not take into account various bursts and sudden changes that are often encountered in real practice. Linearity is greatly influenced by the seasonality of product release, changes in demand in the region, and the emergence of new competitors in the market. All this changes demand in the future. New technologies have a great influence on production, which also determines sales volume.
- The break-even point model is well applicable to markets with low competition and stable consumer demand for manufactured products. Globalization of markets creates more unstable demand for national products.
- The cost of raw materials during production can vary quite significantly.
- Sales volume is influenced by many factors: product quality, size of the dealer network, seasonality, marketing, etc.
- Poorly used for small businesses with fluctuating sales patterns.
Summary
The break-even point model allows you to determine the minimum acceptable limit for sales and production of products for an enterprise. This model can be well used for large enterprises with a stable sales market. Calculating the break-even point allows you to determine the safety zone - the distance of the enterprise from the critical level at which profit is zero.


Popular
- What are futures and why are they interesting to investors?
- Do I need marketing automation: breaking it down by industry
- There is no life without sales planning
- Profitable affiliate programs for making money on the Internet - rating of the most reliable and profitable Popular affiliate programs for making money
- Network Marketing Pros and cons of network marketing - an overview of the main advantages and disadvantages
- Accounting firm how to sell services
- The break-even point is determined by analyzing the ratio of indicators, how to calculate sales volume
- Profession "advertising manager" What are people called who come up with advertising
- Little things matter too
- Gazprom has begun the countdown to the opening of Lakhta Center Lakhta Center current height